Case studies / Linah Farms
Linah Farms · Premium Medjool dates · Egypt · Client since Nov 2024
How Linah Farms grew to 3.6× its annual sales in 22 months, and is still growing
A premium dates farm with a seasonal business and a loyal base. Twenty-two months and two Ramadans into the partnership, the annual sales run-rate is 3.6× what it was, and the latest twelve months grew 48% on top of the twelve before.
Last updated 11 Sep 2026 · figures through Aug 2026 · source: Shopify
3.6×Annual sales run-rateTrailing 12 months, Aug 2026 vs Oct 2024 (Shopify gross sales)
+48%Latest 12 months vs prior 12Sep 2025–Aug 2026 vs the 12 months before · calendar windows, not engagement years (we started Nov 2024)
37,000+Orders since Nov 2024Shopify, 22 months
The case in 30 seconds
The challenge
Demand peaked hard around Ramadan and collapsed after it, ad costs rose in the festive months, and the content direction had stopped moving the brand.
What we changed
Season-first planning across Meta, Google and TikTok, premium farm-to-table storytelling with UGC, and Shopify as the scoreboard for every scaling decision.
The result
3.6× the annual sales, growth in the latest twelve months as well as the twelve before, and more than half of every month’s orders from returning customers.
Our diagnosis
The peak was never the problem. The other nine months were.
One map of the year before touching a campaign.
- Premium product, loyal baseOver half of orders already from returning customers
- Seasonal cliffRamadan carried the year; momentum vanished after it
- Festive-month ad saturationCosts spiked exactly when demand did
- Content had stalledSame direction, fading response
- Google and TikTok under-usedYear-round demand left on the table
The opportunity
Season-first media planMulti-platform mixFarm-to-table UGCShopify-validated scaling
→Growth in every seasonBefore → After
What actually changed
BeforeAfter
BeforeRamadan campaigns, then silence
AfterA plan for all four seasons, with Ramadan as the peak, not the whole year
BeforeMeta only
AfterMeta for storytelling, Google for intent, TikTok for discovery
BeforeProduct-on-white creative
AfterFarm-to-table storytelling, origin, packaging and real customers
BeforePlatform ROAS as the scoreboard
AfterShopify sales and orders decide what scales
BeforeOne-off seasonal pushes
AfterAn engine that grew 48% in its latest twelve months
Growth strategy
One growth system. Four connected levers.
01 — Media
Full-funnel on Meta, intent capture on Google, discovery on TikTok, planned around the gifting calendar.
Prospecting→Retargeting→Retention
Ramadan is the peak; every other month gets its own reason to buy.
02 — Creative
Farm-to-table storytelling with organic certification and gift-worthy packaging, backed by UGC.
Content refreshed before each season, not during it.
03 — Season
Ramadan, national holidays and gifting moments each get their own offer and creative.
Post-season retention campaigns keep the base buying between peaks.
04 — Measurement
Shopify gross sales, orders and returning-customer rate judge every month.
Platform ROAS informs; the store decides.
Performance over time
What happened next
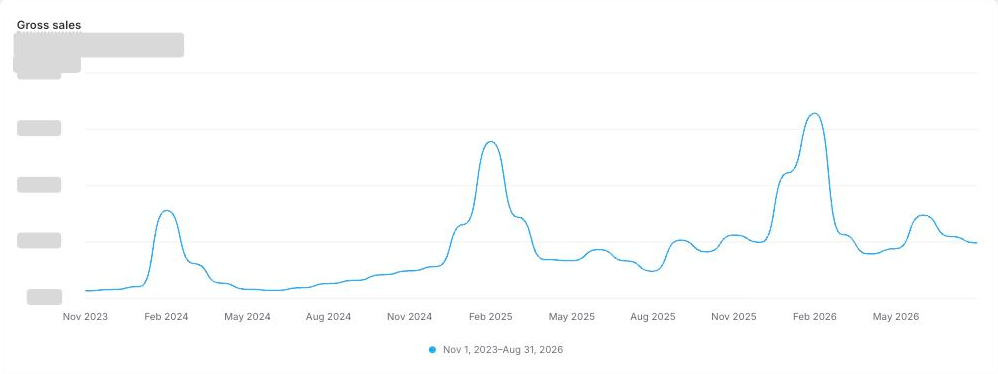
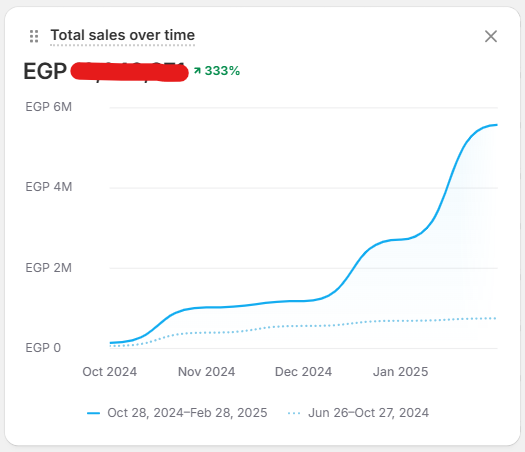
Shopify data, Nov 2023 to Aug 2026, indexed so the trend is visible without disclosing revenue. Below it: the tools, and the numbers.
Documented in the tools
The business impact
Store numbers, not platform numbers. Last 12 months (Sep 2025–Aug 2026) against the 12 months before Adlogic (Nov 2023–Oct 2024).
+256%Gross salesShopify
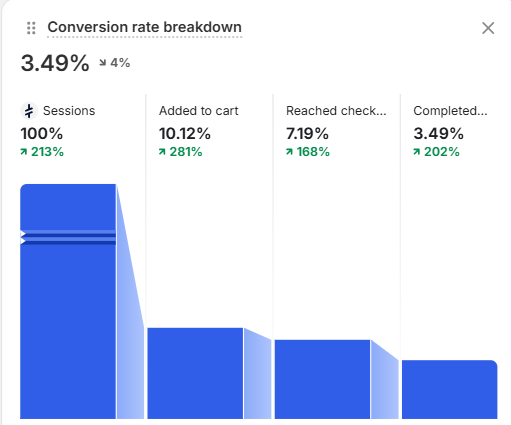
+216%OrdersShopify
+433%Store sessionsShopify
+48%Latest 12 months vs prior 12Sep 25–Aug 26 vs Sep 24–Aug 25 · calendar windows
57%Returning-customer rateHeld above 50% while the base tripled
3×Ramadan season2026 vs 2024, gross sales
Absolute revenue and ad spend are confidential to the client. Every figure is a Shopify percentage or index for the periods stated.
Creative strategy
The creative system
Three representative pieces. Not the gallery, the ones that changed the numbers.
- Format
- Farm story video · TOF
Why it workedBahareya Oasis, the palms and the harvest: origin is the premium proof competitors cannot copy.
- Format
- Gift-box UGC · MOF
Why it workedReal customers unboxing a Ramadan gift box answered the question every gift buyer has: how does it look when it arrives?
- Format
- Reorder reminder · Retention
Why it workedReturning customers are more than half of orders; a well-timed reminder before the season beats any discount.
What we learned
01
A seasonal business is a retention business.
With more than half of orders from returning customers, the cheapest Ramadan sale is to someone who bought last Ramadan. The year is planned around that.
02
Second-year growth is the real proof.
Anyone can post a good first quarter. Growing 48% in the latest twelve months, on top of 166% in the twelve before, is what a system looks like. Both are calendar windows measured Sep to Aug; the engagement began in Nov 2024.
03
Traffic grew faster than orders, on purpose.
Sessions rose 433% while orders rose 216%: discovery on TikTok and Google widened the top of the funnel, and the store, not the ad, decides how fast to scale it.
Scaling an eCommerce brand but losing efficiency as spend grows?
We review media, creative, products and conversion together to identify what is limiting profitable growth.