Case studies / Nacita Auto Care
Nacita Auto Care · Automotive accessories · Egypt · Feb 2023 – Aug 2024
How Nacita Auto Care went from inconsistent returns to a scalable Shopify sales engine
A trusted offline brand with a weak mobile funnel and no ad-ready content. Sixteen months of full-funnel Meta, CRO recommendations and creative direction produced 3,200+ confirmed purchases and a monthly ROAS that stayed between 10.6× and 23.3×.
Engagement closed Aug 2024 · figures as reported at the time

3,200+Confirmed purchases16 months, Shopify-confirmed
10.6–23.3×Monthly ROAS rangeMeta-reported, every month of the engagement
55M+ImpressionsMeta
The case in 30 seconds
The challenge
Strong brand, weak mobile funnel, unstructured creative and no funnel segmentation by product or season.
What we changed
Rebuild tracking and campaign architecture, restructure the site journey, and replace ad-hoc visuals with a performance creative system.
The result
3,200+ purchases and a ROAS floor above 10× for sixteen months.
Our diagnosis
The brand had trust. The store had friction.
Before scaling media we audited the funnel, the tracking and the content.
- Offline brand equityNACITA Group reputation and retail presence
- Low starting conversionWeak mobile funnel and UX
- Unstructured creativeNo conversion intent, little video
- No funnel segmentationProducts and seasons mixed together
- Tracking not alignedPixel, GA4 and Shopify events out of sync
The opportunity
CRO recommendationsEvent-based trackingFull-funnel architectureUGC creative system
→Sustainable, scalable ROASBefore → After
What actually changed
BeforeAfter
BeforeGeneric campaigns
AfterTOF / MOF / BOF architecture segmented by product category
BeforeWeak mobile journey
AfterCRO fixes: CTA contrast, homepage priority, product filtering
BeforeStatic, inconsistent visuals
AfterPerformance statics + iterative UGC and testimonial video
BeforeInstalls of tracking, not events
AfterViewContent, ATC and Purchase events driving the bidding
BeforeMonthly guesswork
AfterMonthly creative reports: underperformers out, winners scaled
Growth strategy
One growth system. Four connected levers.
01 — Media
Broad and lookalike prospecting, video-viewer and cart retargeting, site retargeting.
TOF broad + lookalikes→MOF video viewers + ATC→BOF site retargeting
Segmented by product category and supported by seasonal promos.
02 — Creative
Performance statics first, then UGC and testimonial video tested monthly.
Winners scaled, underperformers phased out on a monthly report.
03 — Product
High-margin SKUs and seasonal bundles got the budget.
Ramadan bundles, travel kits and gadget promos led the calendar.
04 — Measurement
Meta Pixel, GA4 and Shopify analytics aligned before scaling.
Confirmed Shopify purchases, not platform conversions, judged the month.
Creative strategy
The creative system
The pieces that did the work, not the whole gallery.
- Format
- Performance static · TOF
Why it workedClear product value in one frame for a category that rarely communicates it visually.
- Format
- UGC / testimonial video · MOF
Why it workedA customer installing the product in their own car answered the question a static never can: does it fit, does it work.
- Format
- Seasonal bundle · BOF
Why it workedRamadan and travel kits gave cart abandoners a reason to come back that was not a discount.
What we learned
01
Fix the funnel, then scale.
Sixteen months of stable ROAS came from the first weeks spent on tracking and mobile UX, not from bidding tricks.
02
Content compounds when it is reported.
A monthly creative report turned content from a cost into a lever: every month started with the previous month's winners.
03
Structure beats budget in an offline-first category.
Competitors had bigger names and no funnel. Segmentation by product and stage was the advantage.
Proof
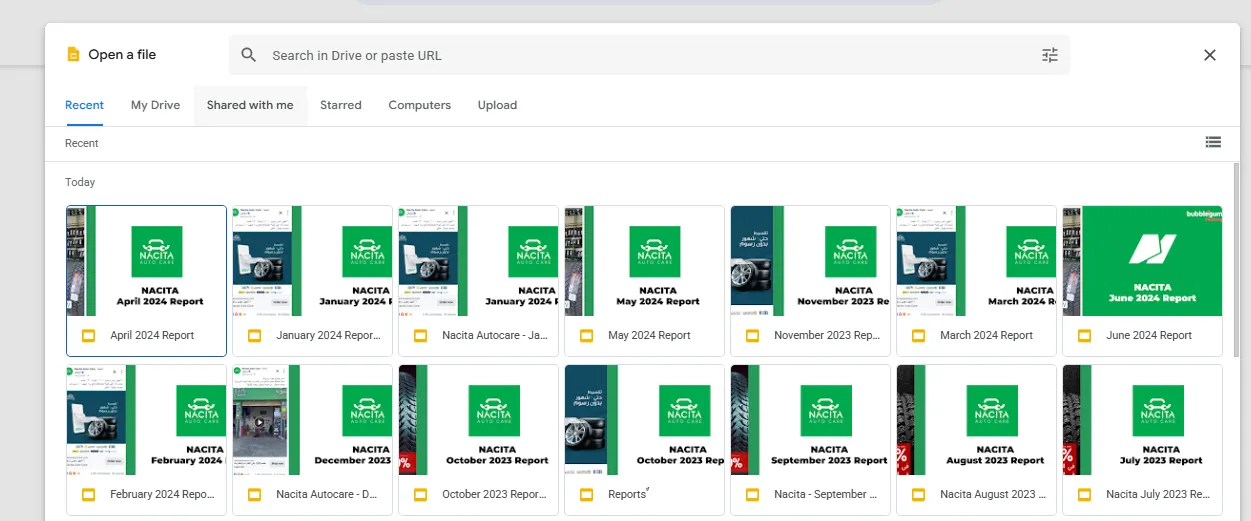
Documented in the tools
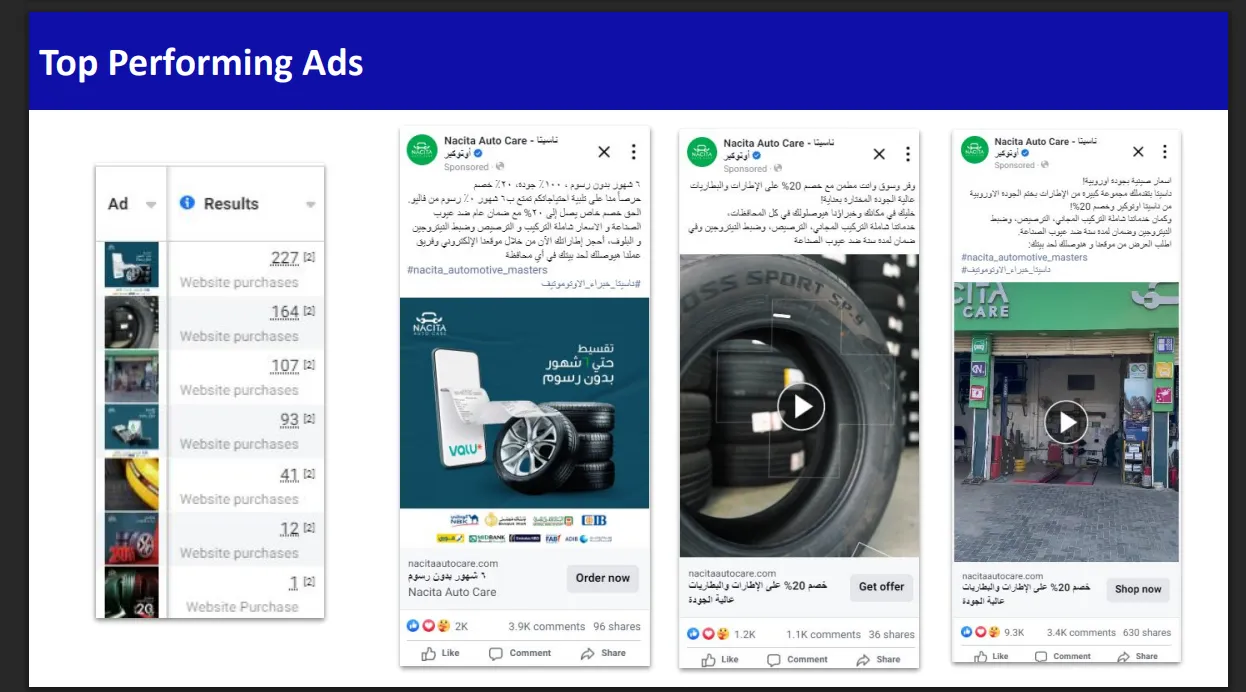
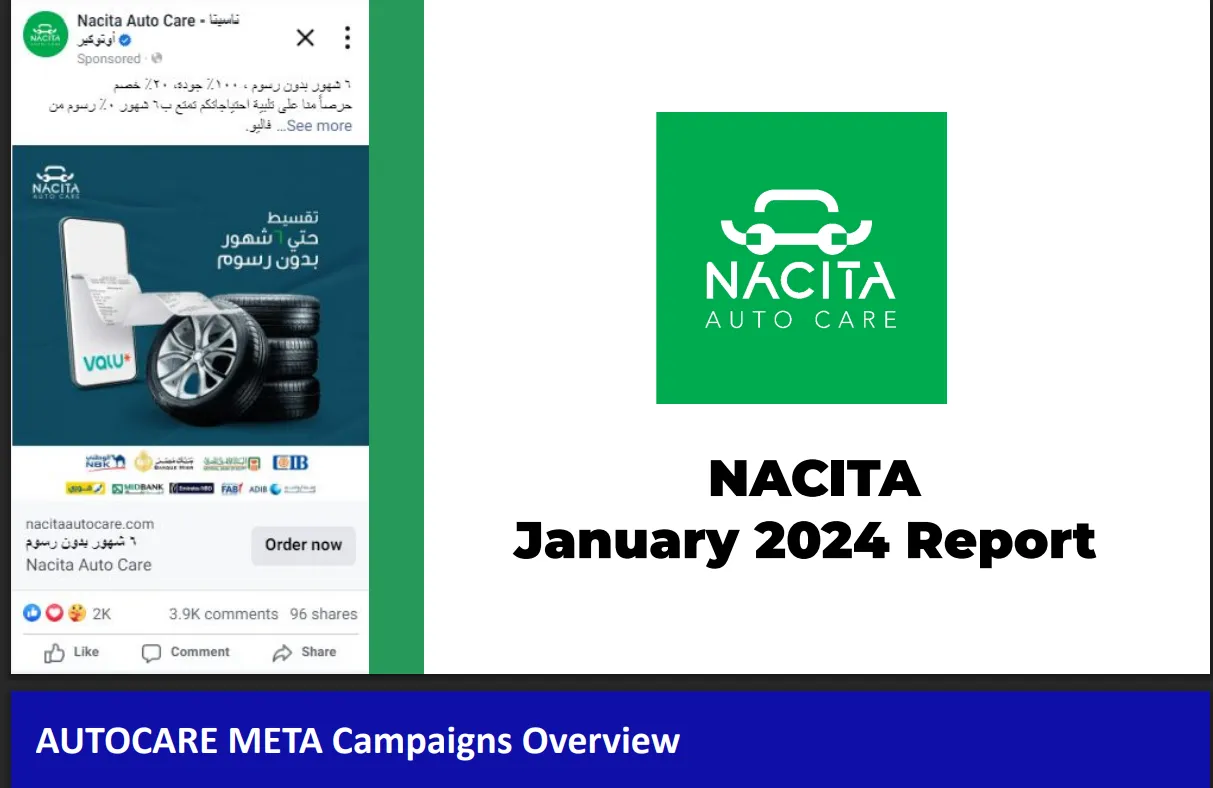
Business impact
The business impact
As reported at the close of the engagement.
3,200+Confirmed purchasesFeb 2023 – Aug 2024
10.6–23.3×Monthly ROASMeta-reported
55M+ImpressionsMeta
200K+Followers gainedMeta
Client spend and revenue are confidential; figures are as reported in the campaign's own reporting for the period stated, with sensitive values in the screenshots redacted.
Scaling an eCommerce brand but losing efficiency as spend grows?
We review media, creative, products and conversion together to identify what is limiting profitable growth.