Case studies / Tijan
Tijan · Modest fashion · Egypt · Client since Jul 2026
How Tijan's sales grew 248% year on year in the first two months with Adlogic
An Egyptian modest-fashion brand with an active store and a summer lull. Two months in, July and August 2026 delivered 3.5× the gross sales of the same months a year earlier, and August became the brand's best non-Black-Friday month on record.
Last updated 11 Sep 2026 · figures through Aug 2026 · source: Shopify · early results, two months in
+248%Gross sales, year on yearJul–Aug 2026 vs Jul–Aug 2025 (Shopify)
+177%Orders, year on yearSame comparison
+37%Monthly sales vs H1 2026Jul–Aug 2026 monthly average vs Jan–Jun 2026
The case in 30 seconds
The challenge
Summer was the weakest season, traffic was flat, and the previous year's July had been the lowest month of the year.
What we changed
A full-funnel Meta rebuild judged on Shopify orders, with creative built for the summer collection instead of waiting for the season to end.
The result
July and August 2026: gross sales +248% and orders +177% year on year, with a 30% higher monthly run-rate than the first half of the year.
Our diagnosis
Summer was the problem, so summer is where we started.
One map of the year before the first campaign.
- Active store, loyal baseAbout 30% of orders from returning customers
- Summer lullJuly 2025 was the weakest month of the year
- Flat trafficSessions had drifted down through H1 2026
- Black Friday dependencyOne month carried the year
- Creative not seasonalSame message across a seasonal category
The opportunity
Full-funnel MetaSeason-built creativeProduct-led structureShopify-validated scaling
→A stronger every-month baselineBefore → After
What actually changed
BeforeAfter
BeforeOne campaign structure all year
AfterProspecting, retargeting and catalogue layers with their own budgets
BeforeCreative independent of the season
AfterSummer collection creative built for July, not after it
BeforeTraffic drifting down
AfterSessions +81% year on year in July–August
BeforePlatform ROAS as the scoreboard
AfterShopify gross sales and orders decide what scales
BeforeWaiting for Black Friday
AfterAugust 2026: the best month on record outside Black Friday
Growth strategy
One growth system. Four connected levers.
01 — Media
Prospecting with collection creative, retargeting on viewed and carted products, catalogue ads on what sells.
Prospecting→Retargeting→Catalogue
Budget moves weekly on Shopify orders, not platform conversions.
02 — Creative
Creative built around the summer collection and the brand's modest-fashion positioning.
Refreshed weekly, judged on purchases.
03 — Product
Collection and product-led campaign structure.
The catalogue layer follows what sells each week.
04 — Measurement
Shopify gross sales, orders and AOV judged against the same months a year earlier.
Two months in, every figure is year on year and clearly labelled early.
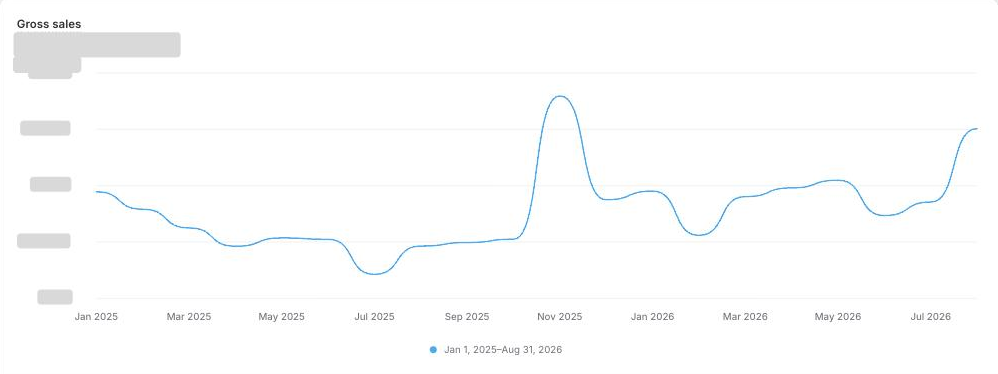
Performance over time
What happened next
Shopify data, Jan 2025 to Aug 2026, indexed so the trend is visible without disclosing revenue. Two months of results, labelled as such.
Gross salesOrders
Documented in the tools
The business impact
Store numbers, not platform numbers. Jul–Aug 2026 against Jul–Aug 2025.
+248%Gross salesShopify
+177%OrdersShopify
+81%Store sessionsShopify
+26%Average order valueShopify
+37%Monthly sales vs H1 2026run-rate
#2August 2026 month on recordOnly Black Friday 2025 was higher
Absolute revenue and ad spend are confidential to the client. Every figure is a Shopify percentage or index for the periods stated.
Creative strategy
The creative system
Early pieces, two months in.
- Format
- Collection video · TOF
Why it workedThe summer collection shown on real women, in the styling the brand's customers actually wear.
- Format
- Product retargeting · BOF
Why it workedThe piece you viewed, back in your feed, with the size and colour options visible.
- Format
- Catalogue ad · Always-on
Why it workedWhat is selling and in stock, updated weekly, for people who already know the brand.
What we learned
01
Start with the weakest season.
Fixing July, the worst month of the previous year, proved the system faster than any peak could have.
02
Two months is early. Say so.
Every figure here is year on year and labelled as early. The page will be updated monthly as the partnership continues.
03
The baseline is the goal, not the peak.
A 30% higher monthly run-rate before Black Friday means the peak now starts from a higher floor.
Scaling an eCommerce brand but losing efficiency as spend grows?
We review media, creative, products and conversion together to identify what is limiting profitable growth.