Case studies / El Abd Patisserie
El Abd Patisserie · Confectionery · Egypt · Client since 2023 · Adlogic's largest account
How El Abd's Mouled season grew to 3.5× its views in three years, and set a channel record in 2026
Egypt's best-known patisserie, three Mouled seasons with Adlogic on the media, and a 2026 season that beat four of six committed targets: 208 million video views, 134 million reached across platforms, 110,626 store actions and the most-watched video in the brand's history.
Last updated 11 Sep 2026 · El Mouled 2026 season closed 31 Aug 2026 · sources: Ads Manager, YouTube public counters, Google local actions
208MVideo views in one seasonEl Mouled 2026 · 66% above the committed target
3.5×Video views, 2024 → 202659.8M views (2024) → 122.2M (2025) → 207.7M (2026)
110,626Store actionsDirection requests + calls · 1.7× the committed target
The case in 30 seconds
The challenge
A brand whose year is decided in a few weeks, media prices roughly doubled in two years, and a season plan with six numbers committed in writing before a single ad ran.
What we changed
Four flights across Meta, TikTok, YouTube and Google, a hero-product creative formula found mid-season and scaled hard, and every budget decision documented week by week.
The result
Four of six targets beaten, 208M views, a channel record, an owned TikTok audience six times larger than 2025, and more views per pound than the year before despite inflation.
Our diagnosis
The season had to beat inflation, not just last year.
Three seasons of data before the 2026 plan was signed.
- A season, not a campaignEl Mouled decides the year for confectionery
- Media inflationViews per unit of media fell 45% between 2024 and 2025
- Six numbers in writingReach, views, YouTube, store actions, interactions, followers
- Reach is not proofThe client needed store demand, not impressions
- Engagement was the expensive lineEngagement carried the highest unit cost of any line in 2025
The opportunity
Hero-product formulaInfluencer stackPlatform rolesStore-demand measurement
→A season that beats its own targetsBefore → After
What actually changed
BeforeAfter
BeforeOne big brand copy carrying the season
AfterFour flights: launch, product lines, offer week, peak wave
BeforeCreative fixed before the season
AfterA formula found on 19 Aug and scaled to 15.2M of 23.1M interactions in 12 days
BeforeEngagement priced at the 2025 rate per interaction
AfterA quarter of that on the Foulya copy — cheaper per interaction than the pre-inflation 2024 era
BeforeReach reported as the result
After110,626 measured store actions: direction requests and calls
BeforeA following that vanished after the ads
After84,121 new TikTok followers, an owned audience for the next season
Growth strategy
One season system. Four connected levers.
01 — Media
Every platform with one job: Meta for engagement, TikTok for plays and followers, YouTube for the brand copy, Google for store demand.
Launch 4–8 Aug→Product lines 8–17→Offer week 18–26→Peak & final wave 25–31
34% of the plan concentrated in offer week; the peak escalated on its planned dates.
02 — Creative
One hero product, a fast vertical-first cut, all three platforms within 24 hours.
The Foulya Spread copy: 26.9M plays and the season's best rate on Facebook and TikTok.
03 — Influencers
Three creators, twelve days, 8.95M interactions from 6.9% of the spend.
Cast and priced well below the 2025 average cost per interaction.
04 — Measurement
Six committed targets, reported against, including the two that fell short.
Ads Manager, YouTube public counters and Google local actions, not one platform's dashboard.
Performance over time
What happened next
Three Mouled seasons with Adlogic on the media, indexed to the first. Spend is confidential; the efficiency line is views per unit of media, shown as an index.
Documented in the tools
The season impact
El Mouled 2026, 4–31 August, against the targets committed before launch.
134MReach, all platforms+46% above the top of the committed range · summed per platform, not de-duplicated across them
23.1MInteractions7.5% under the committed floor, and stated as such
84,121New TikTok followers6.1× the entire 2025 season
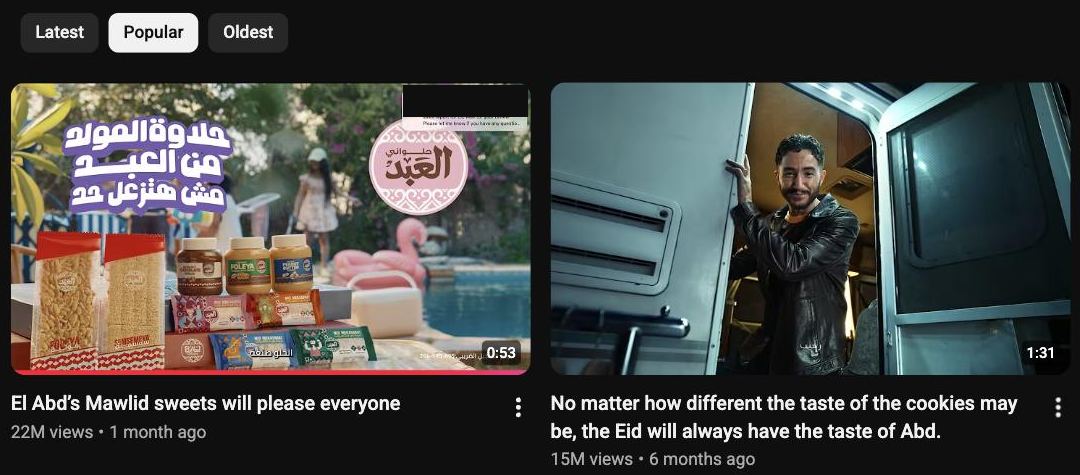
22.5MViews on one copy#1 of 154 videos on the channel
30% underCost per store action vs our internal benchmarkMouled 2026
+18%Views per pound vs 2025Against ~25% media inflation
Media spend is confidential to the client. Figures are as shown in Ads Manager, YouTube public counters and Google's local actions report for the season stated; unit costs and ratios are shown, budgets are not.
Creative strategy
The creative system
The pieces that carried the season, exactly as they ran.
- Format
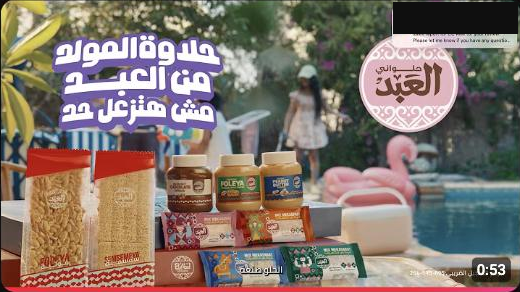
- Brand main copy · YouTube
Why it worked22.5M public views on one copy: the most-watched video in the channel's 154-video history, beating the old 15M record in three weeks.
- Format
- Hero-product cut · Meta + TikTok
Why it workedThe Foulya Spread copy launched on three platforms in a day and delivered 4.43M interactions on Facebook alone, at the lowest cost per interaction of the season.
- Format
- Creator videos · Instagram
Why it workedHalim, Marram and Karim: 26.2M plays, 8.95M interactions, and the most-shared post of the season (3,177 shares).
What we learned
01
Report the misses with the same font size.
Two of six promises landed short: interactions (7.5% under) and TikTok followers (a funding decision, not a performance one). Both are on the client's report with the arithmetic. That is why the relationship is in its third year.
02
The formula beats the budget.
The five copies launched after 19 August produced 15.2M of the season's 23.1M interactions. Discovering and scaling a creative formula mid-flight mattered more than front-loading media.
03
An owned audience is the durable result.
84,121 followers stay after the ads stop. The next season starts from an audience that did not exist a year ago.
Running a seasonal brand and want the next season to beat the last one?
We plan, buy and measure seasons across Meta, TikTok, YouTube and Google, and report against the numbers we committed to.