Case studies / Game Guru
Game Guru · Gaming & consoles store · Egypt · Client since May 2026
How Game Guru tripled its monthly orders in the first four months with Adlogic
A specialist gaming store with a small, high-ticket order base and a conversion rate that had collapsed below 0.3%. Four months of full-funnel Meta judged on Shopify orders turned it into a store that sells every day.
Last updated 11 Sep 2026 · figures through Aug 2026 · source: Shopify · early results, four months in
+219%Orders, year on yearMay–Aug 2026 vs May–Aug 2025 (Shopify)
4.5×Store conversion rate1.23% in May–Aug 2026 vs 0.27% in Jan–Apr 2026
+61%Gross sales, year on yearSame comparison
The case in 30 seconds
The challenge
A niche store selling consoles and gaming gear: a few high-ticket orders a month, traffic that did not convert, and a conversion rate that had fallen below 0.3% in early 2026.
What we changed
Full-funnel Meta built around the products people were actually searching for, retargeting on viewed and carted items, and Shopify orders as the only scoreboard.
The result
Orders tripled year on year, conversion rate rose 4.5× against the first four months of 2026, and gross sales grew 61% while the basket moved to everyday gaming gear.
Our diagnosis
Traffic was arriving. Almost nobody bought.
One map of the store before the first campaign.
- Specialist categoryConsoles, controllers, accessories: high intent, high ticket
- Tiny order baseTens of orders a month, mostly single big-ticket items
- Conversion collapsed0.27% in Jan–Apr 2026; traffic without buyers
- No funnel structureNo retargeting on the products people viewed
- Mix skewed to consolesAccessories and games under-sold despite demand
The opportunity
Product-led prospectingViewed/carted retargetingAccessories & games mixShopify-validated scaling
→A store that sells every dayBefore → After
What actually changed
BeforeAfter
BeforeBoosted posts and a few console ads
AfterProspecting → retargeting → catalogue, each with its own budget
BeforeSessions that did not convert
AfterConversion rate 0.27% → 1.23%
BeforeA handful of console orders a month
AfterEveryday orders across consoles, controllers, games and accessories
BeforePlatform ROAS as the scoreboard
AfterShopify orders and gross sales decide what scales
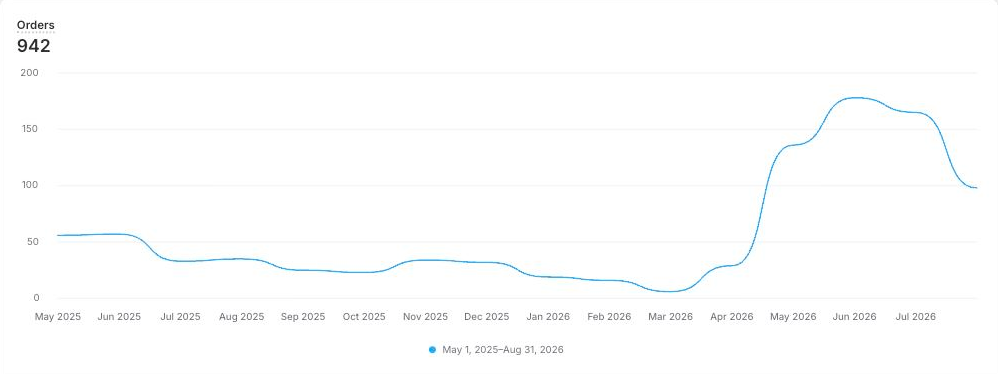
BeforeBest month ever: 57 orders
After178 orders in June 2026, then a steady 100–170 a month
Growth strategy
One growth system. Four connected levers.
01 — Media
Product-led prospecting on Meta, retargeting on viewed and carted items, catalogue ads on what sells.
Prospecting→Retargeting→Catalogue
Budget moves weekly on Shopify orders.
02 — Creative
Product-first creative: the console, the controller, the game, the price, the availability.
Gamers already know what they want; the ad has to prove the store has it.
03 — Product
Widened the mix from consoles to controllers, games and accessories.
More orders at a lower basket, and a store people come back to.
04 — Measurement
Shopify orders, conversion rate and gross sales, year on year against the same months.
Four months in, every figure is labelled early.
Performance over time
What happened next
Shopify data, May 2025 to Aug 2026, indexed so the trend is visible without disclosing revenue. Four months of results, labelled as such.
OrdersGross sales
Documented in the tools
The business impact
Store numbers, not platform numbers. May–Aug 2026 against May–Aug 2025.
+219%OrdersShopify
+61%Gross salesShopify
+135%Store sessionsShopify
1.23%Conversion ratevs 0.27% in Jan–Apr 2026
8×Orders vs Jan–Apr 2026monthly average
178Orders in June 20263× the previous best month
Absolute revenue and ad spend are confidential to the client. Every figure is a Shopify percentage, count or index for the periods stated.
Creative strategy
The creative system
Early pieces, four months in.
- Format
- Product + price video · TOF
Why it workedFor a category bought on intent, showing the exact product, its price and that it is in stock beats any lifestyle angle.
- Format
- Viewed-product retargeting · BOF
Why it workedThe console or controller someone viewed, back in their feed, with delivery time visible.
- Format
- Accessories bundle · MOF
Why it workedControllers, headsets and games paired with the console people came for: the basket that made everyday orders possible.
What we learned
01
Volume first, basket second.
Orders tripled while the average order fell by half as the mix moved from consoles to everyday gear. That is the right trade at this stage: a base of repeat buyers is worth more than a few big tickets.
02
Intent categories want product ads, not brand ads.
Showing the exact product, price and stock did more for conversion than any creative concept.
03
Four months is early. Say so.
Every figure here is year on year and labelled as early. The page is updated monthly as the partnership continues.
Scaling an eCommerce brand but losing efficiency as spend grows?
We review media, creative, products and conversion together to identify what is limiting profitable growth.